Here is a guide to debugging Electron App with VS Code. It uses Electron 2.0, works on all platforms, and includes instruction for debugging both Main and Renderer process.
I’ll be using electron/electron-quick-start.
Clone and open the project in VS Code. Then go to the Debug View and click the configure icon
to make an empty launch.json.
You can also skip this tutorial and grab the code at: octref/vscode-electron-debug
Main Process
Fill launch.json with the following.
{
  "version": "0.2.0",
  "configurations": [
    {
      "name": "Debug Main Process",
      "type": "node",
      "request": "launch",
      "cwd": "${workspaceRoot}",
      "runtimeExecutable": "${workspaceRoot}/node_modules/.bin/electron",
      "windows": {
        "runtimeExecutable": "${workspaceRoot}/node_modules/.bin/electron.cmd"
      },
      "program": "${workspaceRoot}/main.js",
      "protocol": "inspector"
    }
  ]
}
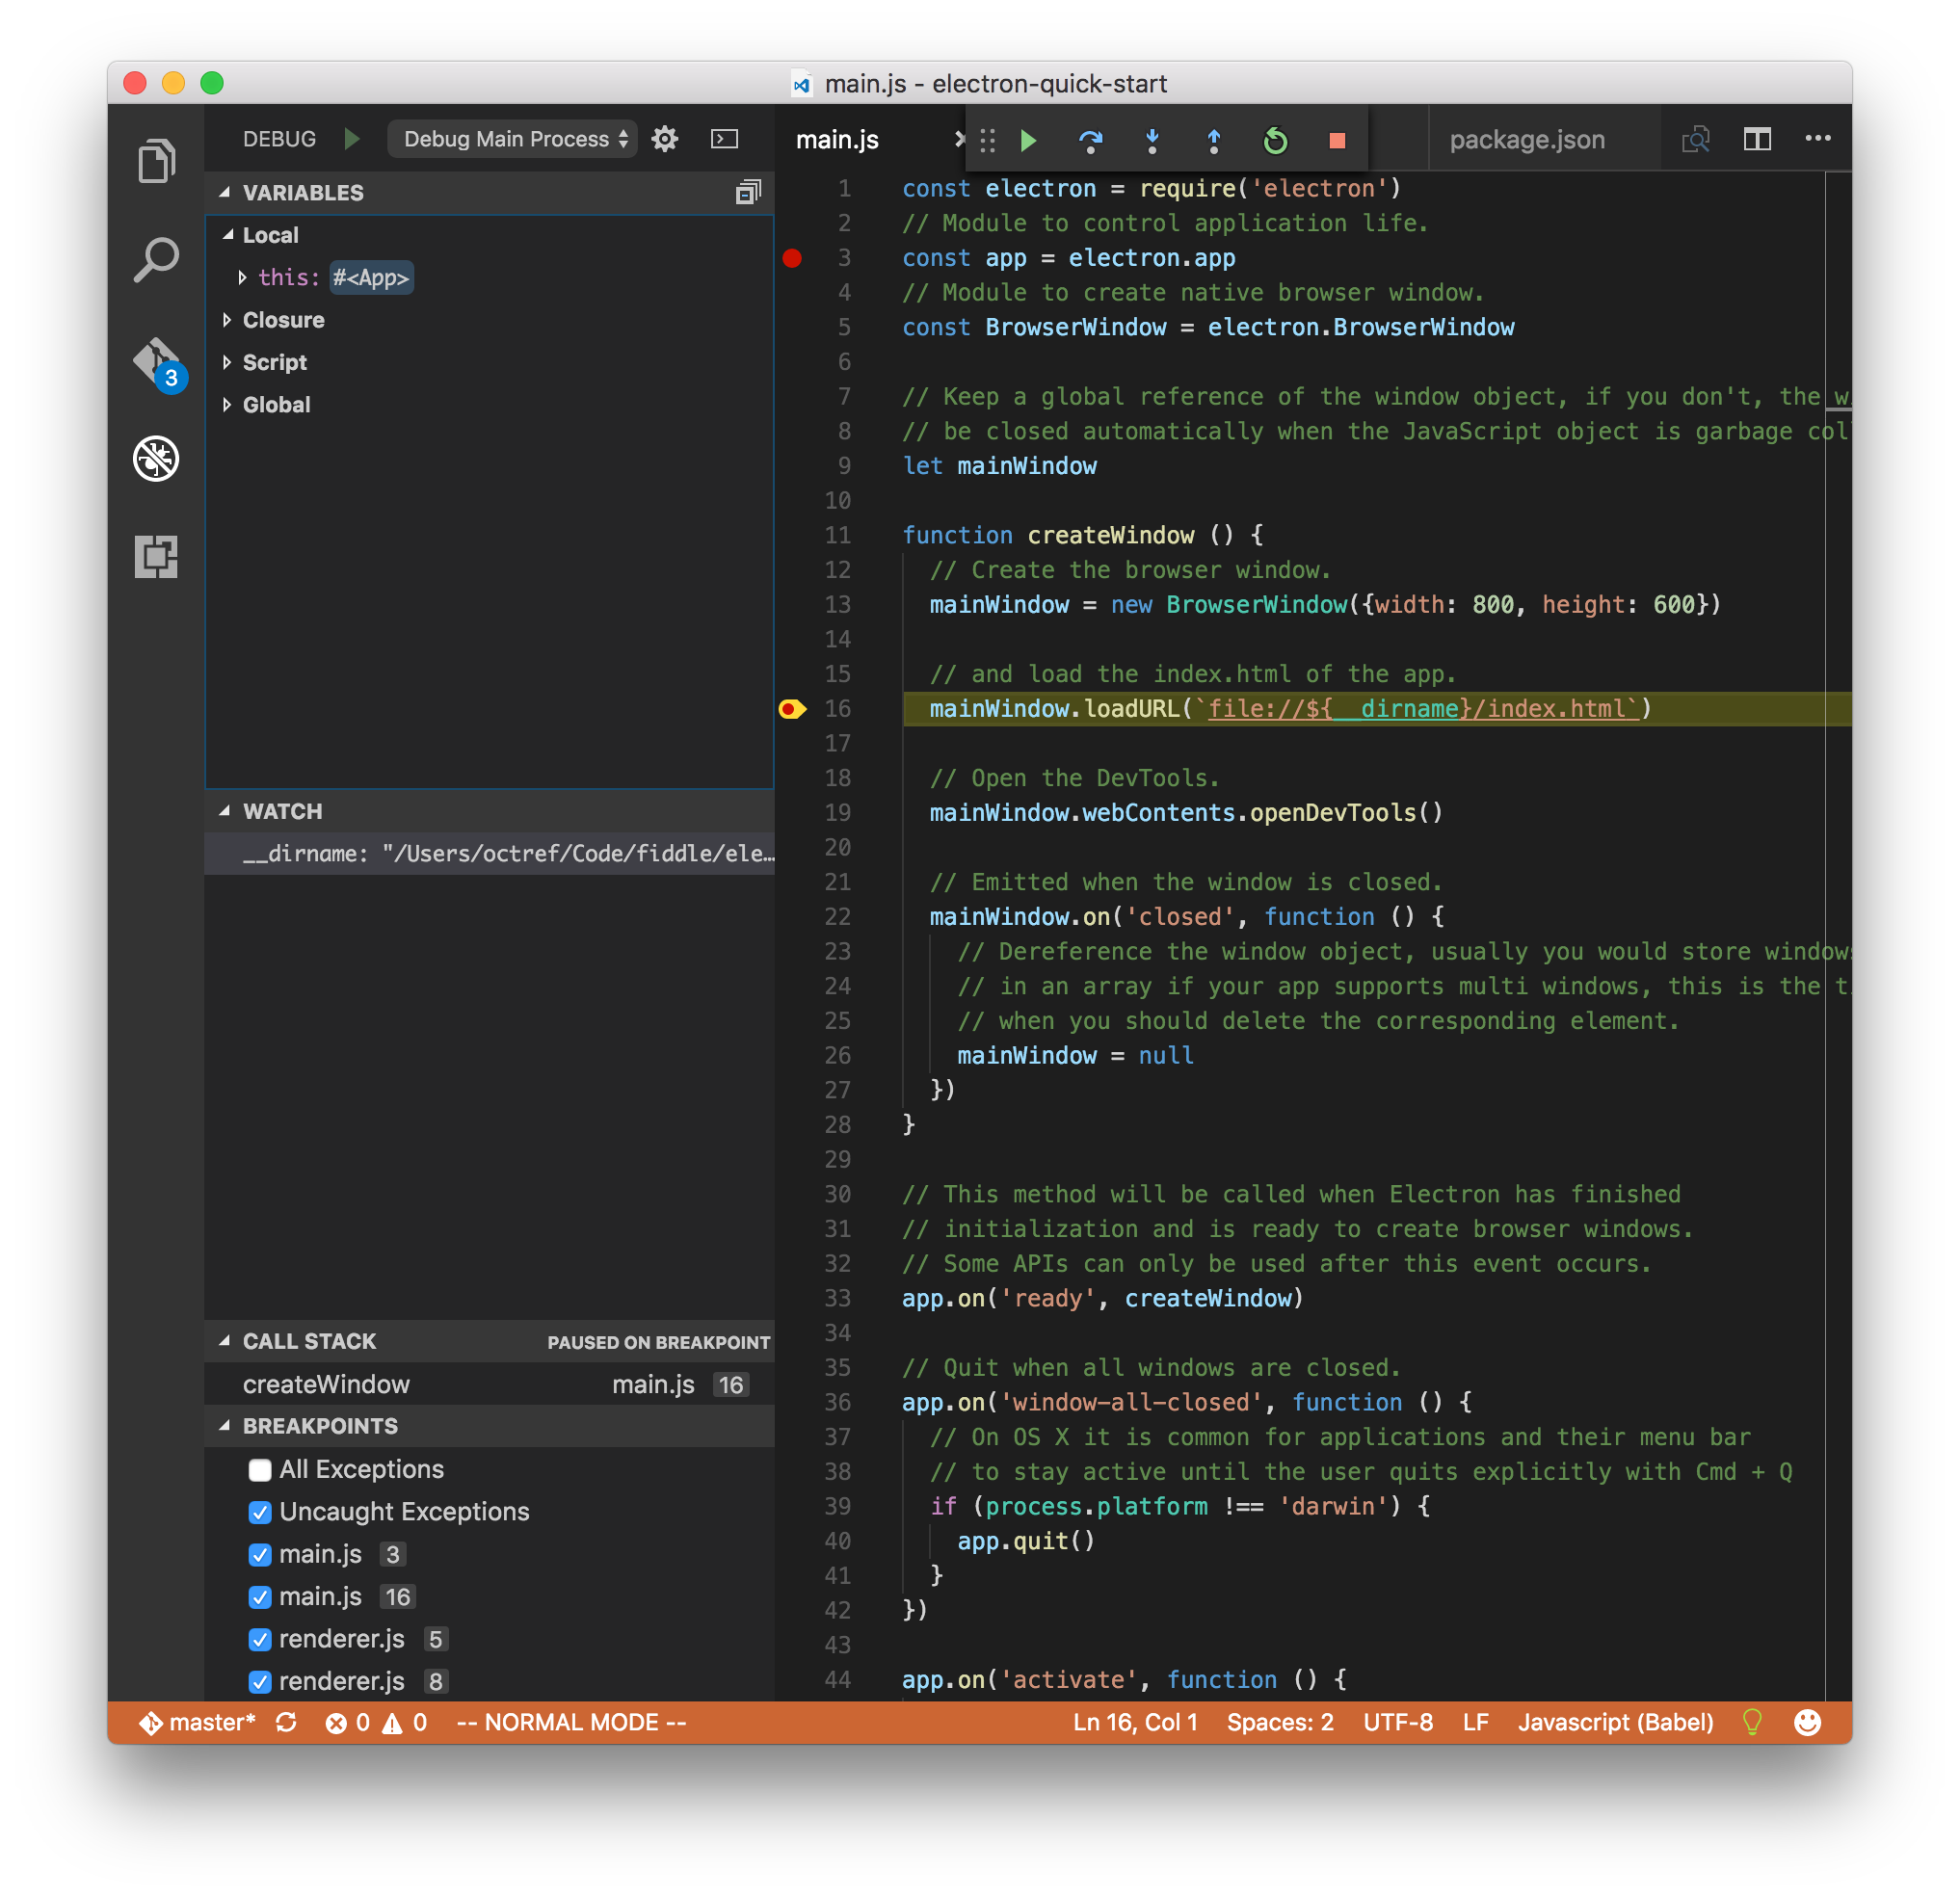
The setting is pretty self-explanatory, use the electron in node_modules to run main.js.
If you go to the Debug View and run Debug Main Process, you should see the code stopping
at the breakpoints in main.js.
Renderer Process
Making Renderer process work involves more effort, but as most of Electron App’s code lives in Renderer Process, it is of more interest.
First, a high-level explanation as to how we’ll make it work. Electron has a launch flag
--remote-debugging-port, which lets you specify a port for remote debugging. The language
spoken at this port is Chrome Debugging Protocol,
and VS Code has an extension that just handles that: Debugger for Chrome.
Setting up
Go to main.js and comment out this line:
mainWindow.webContents.openDevTools()
Remote debugging doesn’t work with multiple DevTools clients. We’ll use the debugger in VS Code instead of Electron’s DevTools.
Install Debugger for Chrome
Launch Quick Open, and enter ext install debugger-for-chrome.
Add a new configuration in launch.json
{
  "version": "0.2.0",
  "configurations": [
    {
      "name": "Debug Renderer Process",
      "type": "chrome",
      "request": "launch",
      "runtimeExecutable": "${workspaceRoot}/node_modules/.bin/electron",
      "windows": {
        "runtimeExecutable": "${workspaceRoot}/node_modules/.bin/electron.cmd"
      },
      "runtimeArgs": [
        "${workspaceRoot}/main.js",
        "--remote-debugging-port=9222"
      ],
      "webRoot": "${workspaceRoot}"
    }
  ]
}
Most of the configuration is straightforward. 9222 is the port Debugger for Chrome uses
by default, and webRoot tells Debugger for Chrome the location of the source code that
we want to debug for.
Add some code to renderer.js
console.log('hello world!')

document.body.addEventListener('click', () => {
  console.log('hello vscode!')
})
Now we are ready to go.
Debugging
I added two breakpoints in renderer.js, and ran Debug Renderer Process in the Debug View.
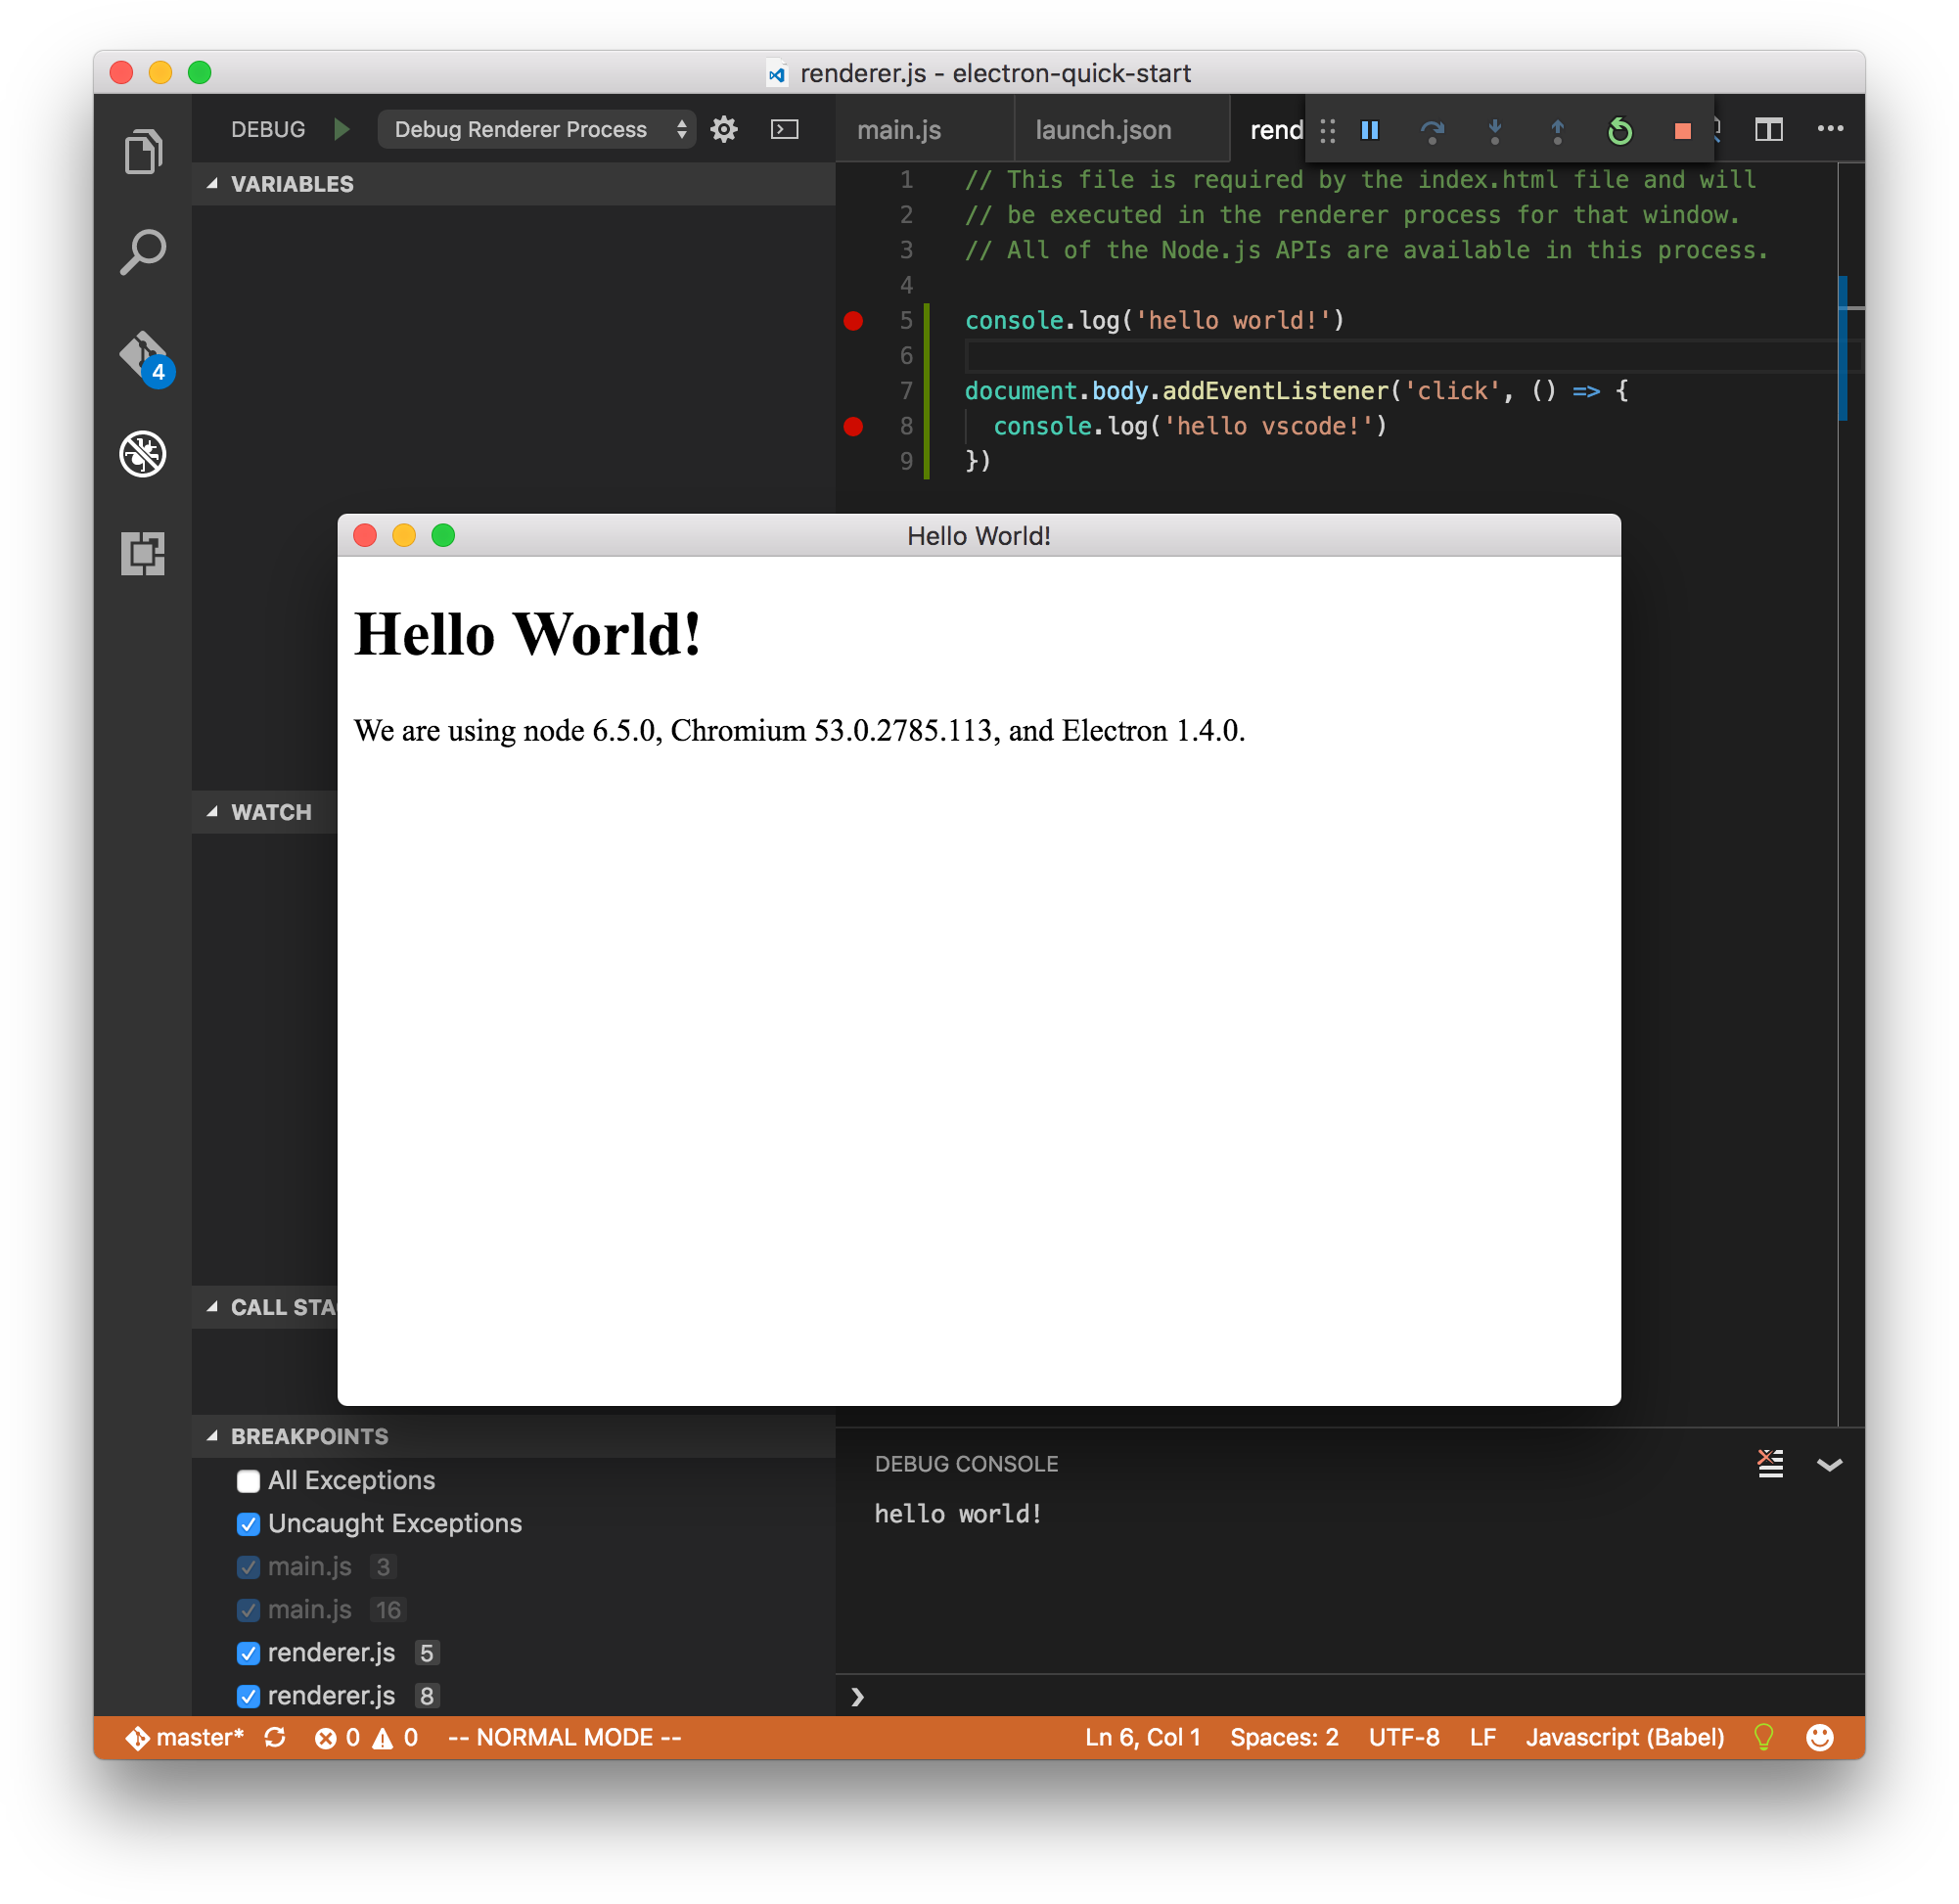
Electron will stop on the second breakpoint if I click anywhere in the window:
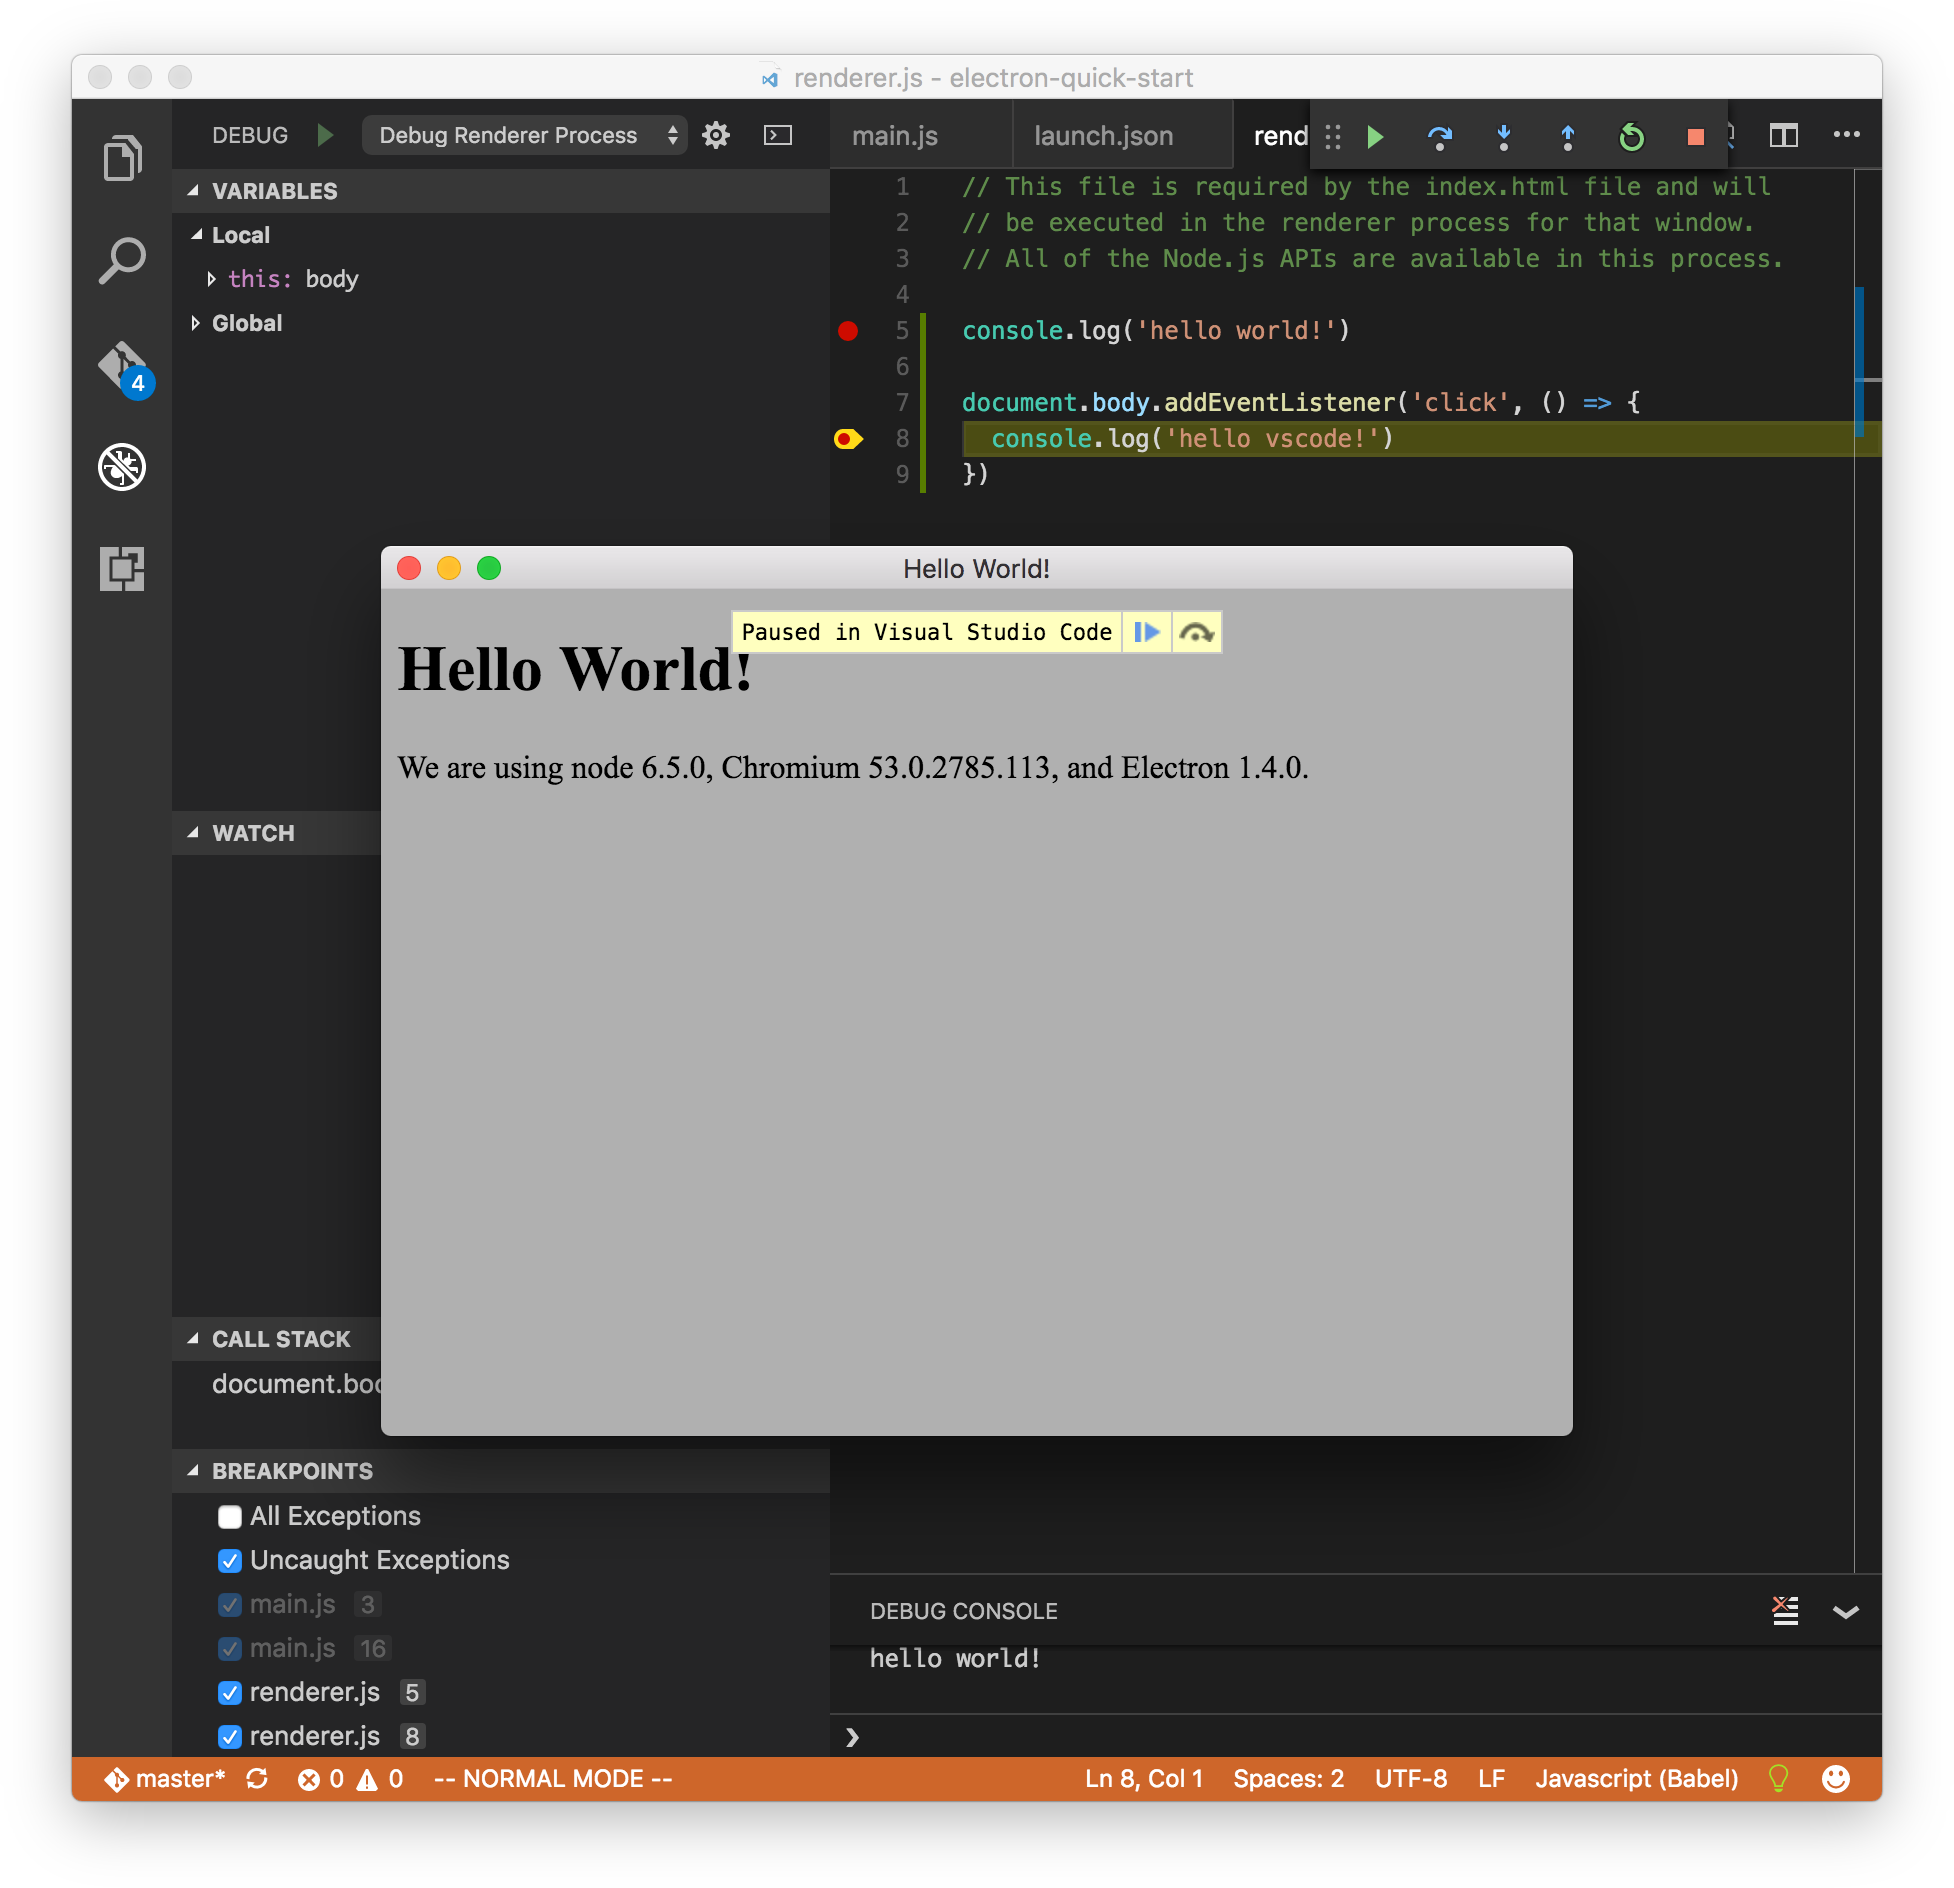
However, it wouldn’t hit the first breakpoint. The reason is Debugger for Chrome would
first launch Electron, and try to attach to the running process to debug it. When it
successfully attached itself, the first console.log had already been executed.
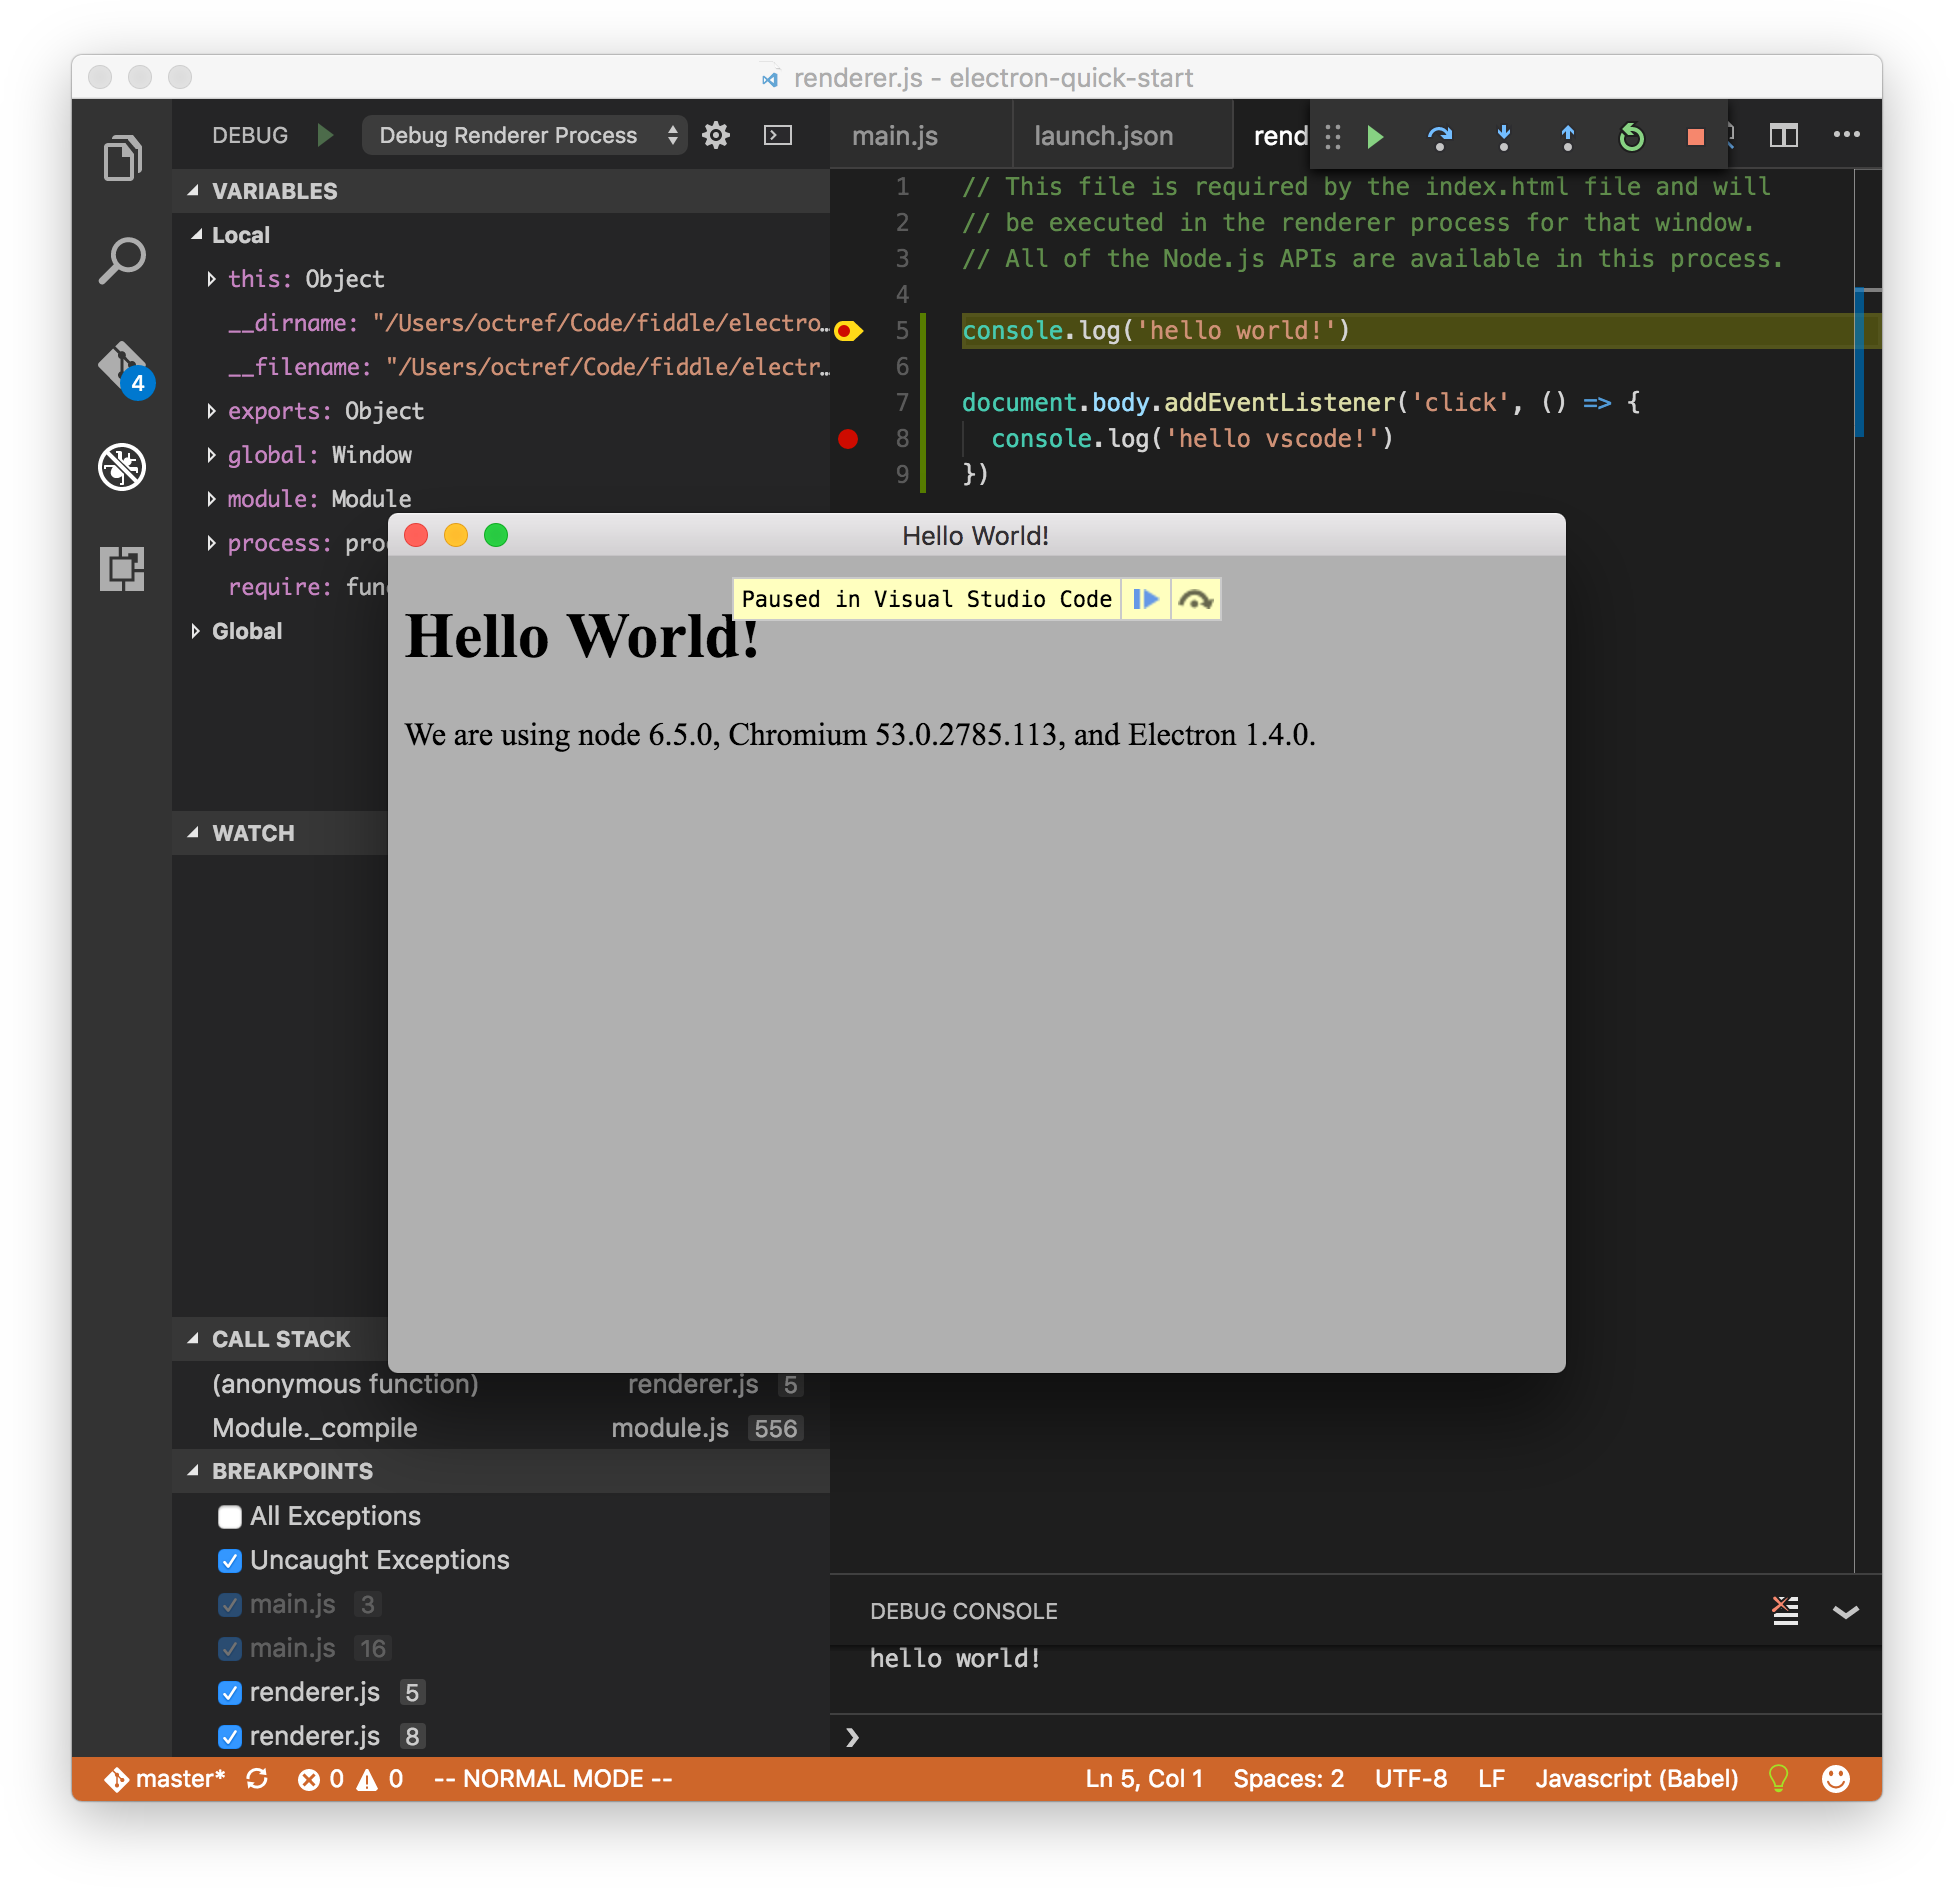
The solution is to go to the Electron window and press cmd+r to reload, Electron will
re-execute the renderer and hit the breakpoint.
Transpiling
Most modern Web apps are written in languages that transpile to JavaScript. If sourcemaps are generated during transpilation, we can debug the original code in VS Code.
I modified electron/electron-quick-start to use Babel and Webpack to transpile ES6 code. Here I’m debugging the un-transpiled code:
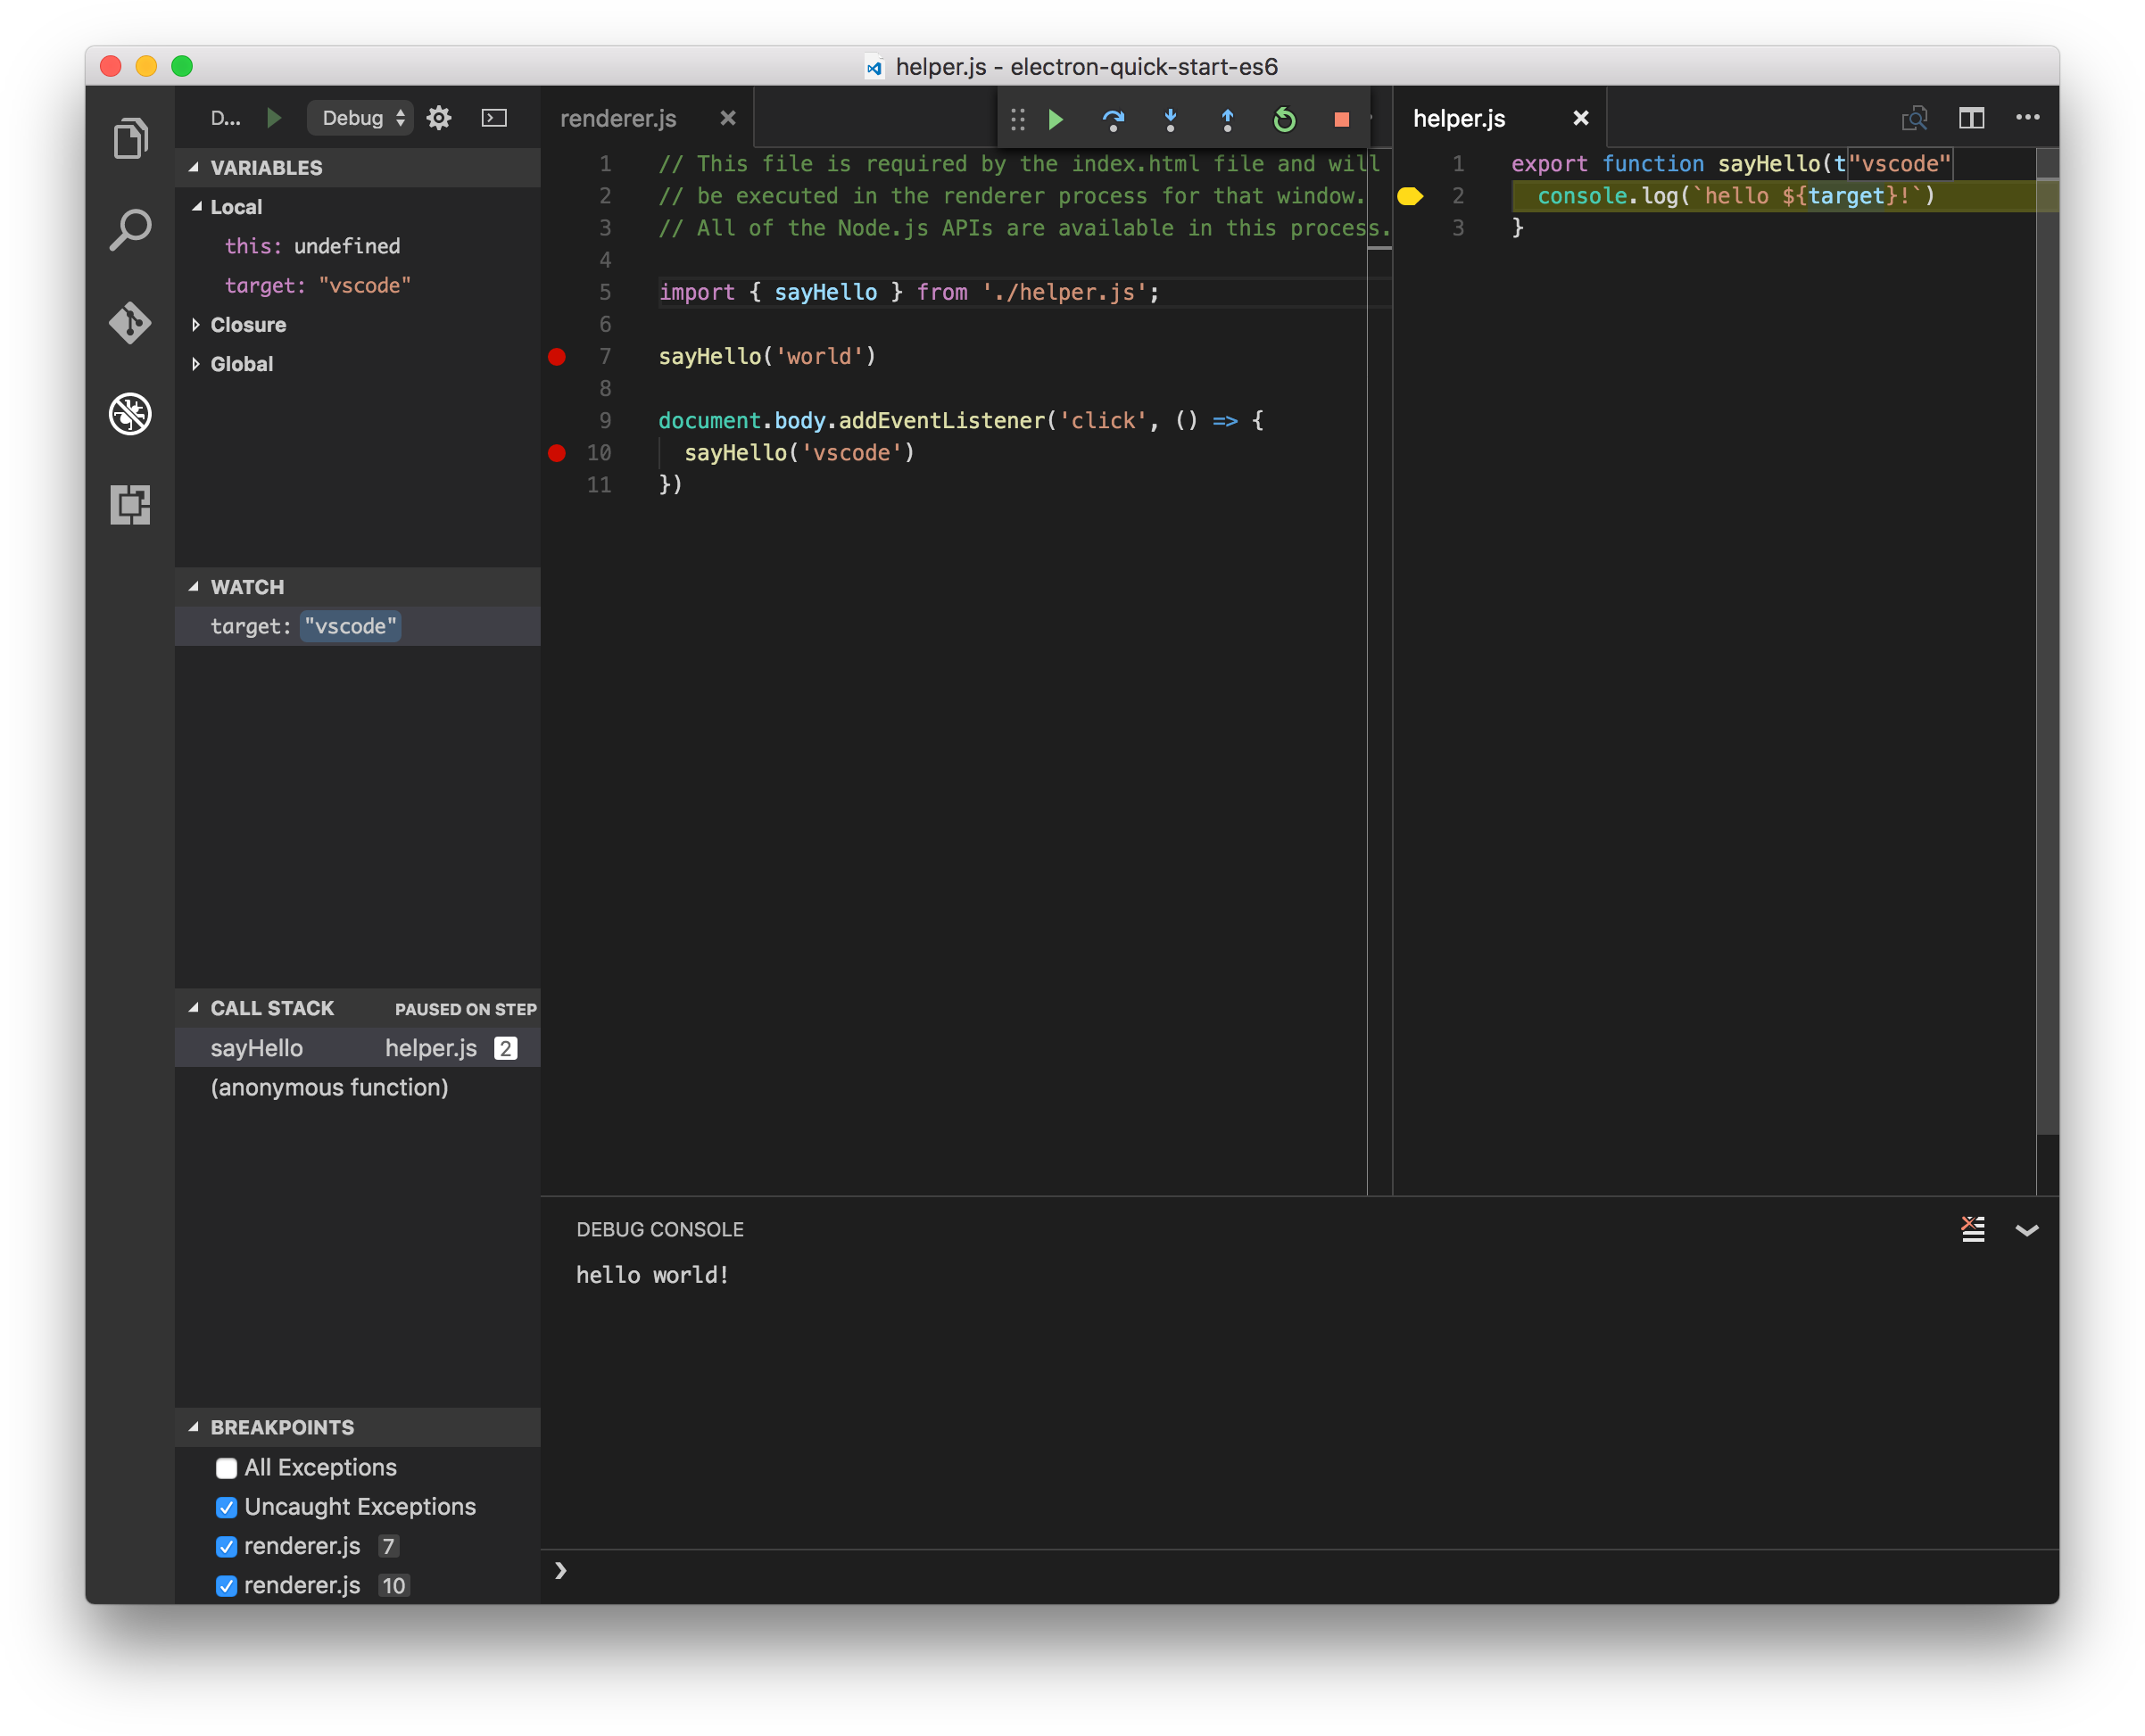
Details are in this commit: 4bb4a93
Why all the hassle?
You get all the nice features in VS Code while debugging, like:
- Go to Definition
- Peek definition
- Use Vim commands to jump around, thanks to VSCodeVim
- Code folding
When inspecting DOM, I still need to go back to Chrome DevTools. But I find myself debugging much faster in VS Code, which I use everyday for coding.
Example Code
https://github.com/octref/vscode-electron-debug
Open an issue if you have any question.
- 2017-02-18: Updated
launch.jsonformat - 2017-10-15: VSCode -> VS Code
- 2018-06-10: Updated blog post for Electron 2.0